261 Broad Street
Windsor, CT 06095
(860) 285-0172
support@invisiblegold.com
Your Website Should Be Easy to Edit
Windsor, CT 06095
(860) 285-0172
support@invisiblegold.com
Your Website Should Be Easy to Edit
Understanding Website Traffic
This article introduces Invisible Gold’s traffic charts. The same concepts apply to any website, though you need to use a third-party software to get the same results. |
What is Website Traffic?
How to Access Your Traffic Logs
Hits Are Not Visitors
Bots, Spiders, and Viruses, Oh My!
Traffic Source
Pages Per Visitor
Search Engines
Sales Charts
Digging Deeper
What is Website Traffic?Website traffic is a graph of the number of people visiting your site. The Internet is a strange place. It looks like just a series of web pages that we visit with a web browser. However, there is a lot more going on. A web site sees a wide variety of traffic, and only a portion of it has a person sitting on the other end. There are thousands of companies building tools that visit and gather information from websites. For an example, check out www.archive.org. This organization has archived snapshots of websites for the past 5-10 years. Search engines are similar. They visit and cache content on a list of websites (Google claims 3.3 billion pages). Another example is www.seventwentyfour.com - this company regularly visits your website checking for errors. If something is found, they contact you and offer their services. It's all pretty clever. In addition to these companies, there is also a dark side. There are programs called "email harvesters" that collect email addresses to sell to spammers. This is why you should be careful about putting your email address on a website. There are also hackers and worm viruses randomly attacking servers using common exploits. There is no use questioning why they do it, just understand they are visiting your website and effecting traffic data.
|
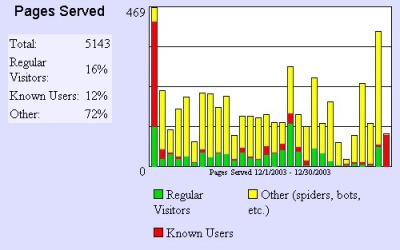
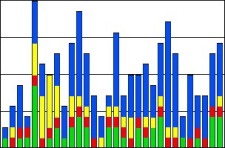
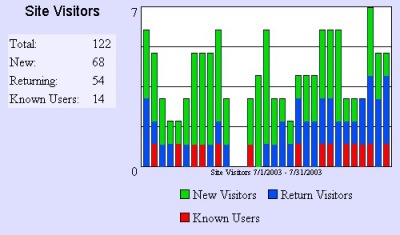
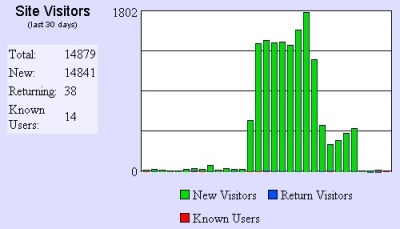
Hits Are Not VisitorsListen carefully when someone tells you how much traffic their website handles. It used to be common to talk about "hits". A hit is any file that gets downloaded from the server. A single page often requires 20 or more different files and thus would register 20 hits. If a single visitor clicks on 10 pages it would register as 200 hits. I know about a company that sells advertising on their website and talks about their 30,000-50,000 hits per month. It sounds low when you realize that most of that traffic probably comes from the 100 advertisers. The important measure of a website is how many people are actually visiting. Invisible Gold considers a visitor a single person that went to the website one or more times in a single day. New visitors are green. Return visitors are blue. Your visits are red. Lots of green traffic means that you are doing a good job of bringing in new visitors. Lots of blue traffic means that you are doing a good job of giving visitors a reason to come back.
|
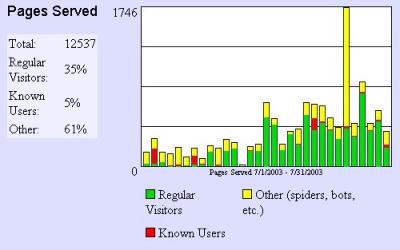
Bots, Spiders, and Viruses, Oh My!The yellow on the Pages served chart gives you an idea of just how much non-human traffic is hitting your website. Usually this will be relatively smooth, however big yellow spikes usually indicate an attack from a worm virus on another server. If you are seeing the spikes, it’s ok. The server repelled the attack. However, if there are many spikes or the number of pages served is more than a few thousand, contact your system administrator. It might indicate a diligent person trying to attack your site directly. Otherwise, just take comfort in knowing that your site is well protected against these attacks and any popular website will see a number of them. This chart shows traffic on a website that was building over the month. Interestingly, the number of visitors remained static - they just loaded more pages per visit. Also, the red indicates the people editing content on the site, and the yellow spike was an attack from a CodeRedII worm.
|
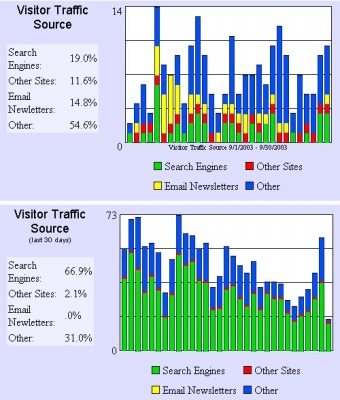
Traffic SourceThe traffic source chart gives you an idea of where people are coming from to visit your site. Here are two examples. One of them derives most of its traffic from email newsletters. The yellow indicates when visitors are actually clicking on a link in an email to visit the site. Visitors that type the address in by hand show up as blue. The second image shows traffic from a much larger ecommerce site that derives most of its traffic from search engines. They have spent much more time honing their content to do well for certain popular keywords. Note how most of their traffic is green. It's less common for a site to get most of its traffic from other websites - though it would show up as mostly red.
|
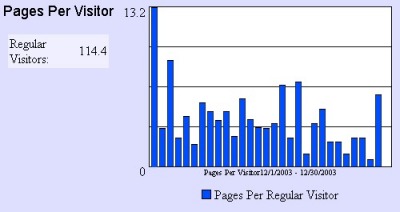
Pages Per VisitorUltimately we should strive to make "stickier" websites. This means that we want people to view as many pages as possible per visit in the idea that this indicates more interest. Large ecommerce sites often try to do the opposite - they try to minimize the number of pages people visit before making a purchase. Most of us aren't at that point yet. To make the most use of this chart, visit your site and count the number of pages that you load for a "good" visit and then compare this against the average in the chart.
|
Search EnginesThere are some special cases where the traffic patterns look strange. For example, Google is by far the most important search engine. This chart gives a nice example of what some people call the "Google Dance". This popular new website finally got indexed so people started visiting it. Then it disappeared from the search engine for two weeks. It's a bit of a tease, but luckily it always comes back.
|
Sales ChartsAnalyzing the traffic for an ecommerce site is similar to a regular site. However, it also includes two other factors. Ultimately your goal is to sell more to fewer visitors or increase your "conversion rate". Second, you want to increase the value brought in per visitor. Most of this discussion is beyond the scope of this document. Contact us for more information as we can help you increase the yield of your ecommerce site. |
Digging DeeperFinally, there are ways that you can dig deeper into your traffic logs to determine your most popular pages, the most common keywords, referring urls, and more. Invisible Gold offers the ability to export the raw log data, and adds new features regularly. There are many factors to consider, and we offer consulting service to help you achieve your website goals. Contact us for more information. |
Invisible Gold, LLC was founded in 2001 as a web design and internet software company. The owner, John Waiveris, wanted to enable people to manage their own websites. John is active in the Windsor community and the Invisible Gold website software is used daily by 600 businesses.
Latest News
- Website Performance TestingTwo tools for testing website speed
- Meta Tags vs. Keywords: Your Site's Visibility
- Don't Get Tricked By "Domain Registry of America"The Domain Registry of America has recently sent out a countless number of letters and emails in a campaign to get you to switch to their domain registry service by using language that suggests that your domain will expire, and that in order to prevent losing it, you must register with their company. The email is disingenuous at best and fraud at its worst.
Contact Us
Windsor, CT 06095
(860) 285-0172
support@invisiblegold.com
Your Website Should Be Easy to Edit
2026 © All Rights Reserved. Terms of Service